 Mostafizur Rahman
Data Analytics · Data Science · BI
From raw data to decisions you can trust.
I'm Mostafizur Rahman. I work across data analytics, business intelligence and machine learning, turning complex data into reliable analysis, models and dashboards with Python, SQL and Power BI.
1 / 6
- Certified
- IBM Data Analyst & Data Science Certificates
- Experience
- Data quality, Analytics, and Business operations
- Focus
- Data Analytics, Business Intelligence, and Data Science
Selected work
Case studies with the evidence shown
Business question, data, method, result and limits for each project.
-
Retail Supply Chain Sales & Profitability Analytics
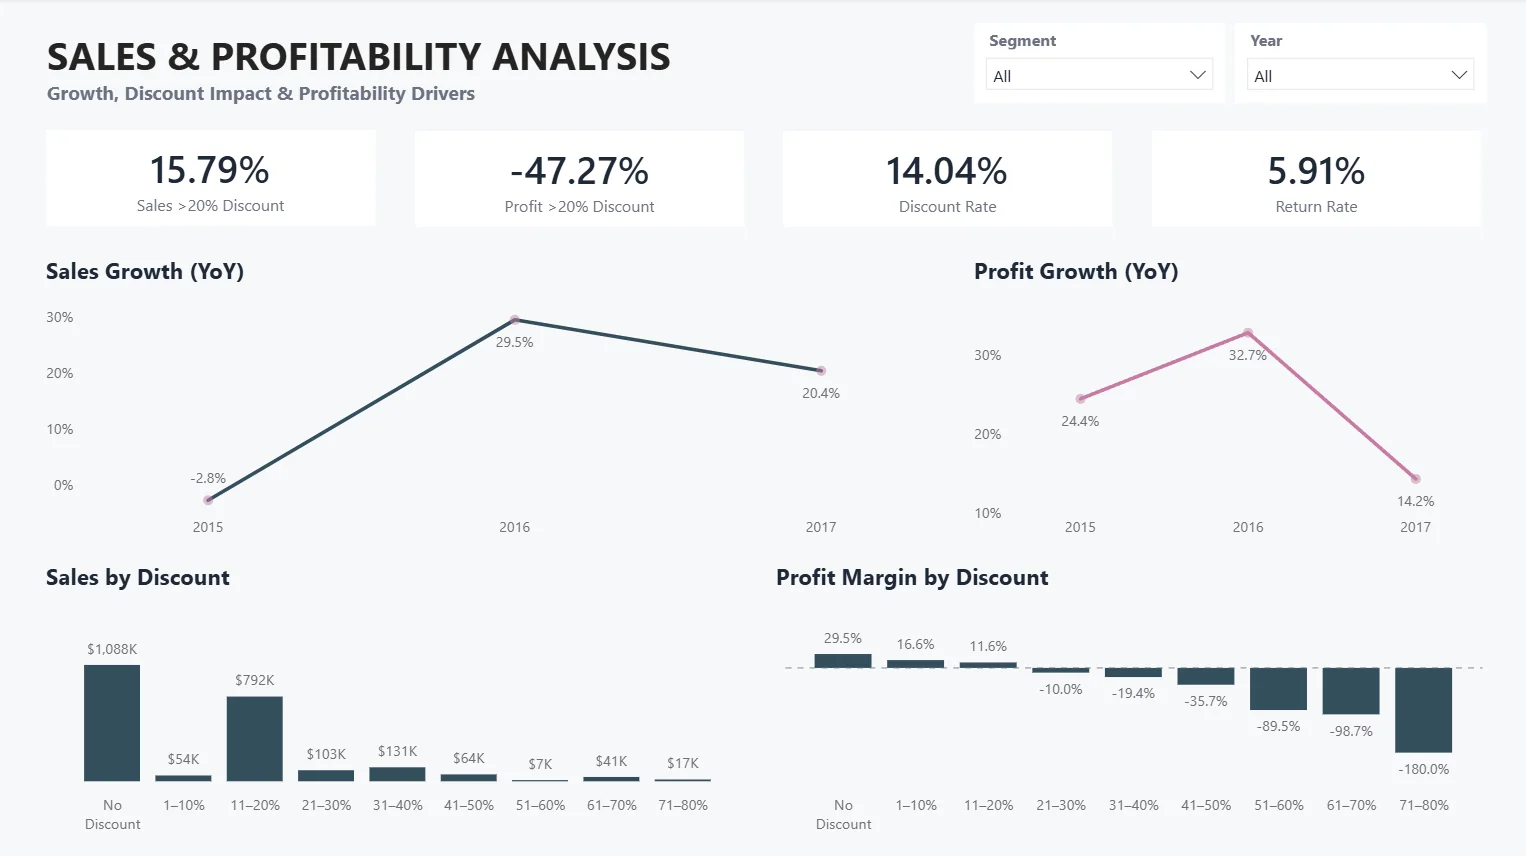
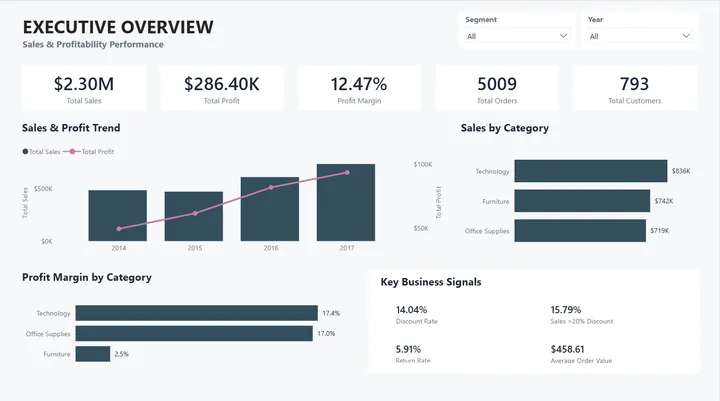
Discounts above 20% covered 15.79% of sales but lost $135,376 in profit. A Power BI report shows where margin disappears.
Python · Power Query · DAX · Power BI
-
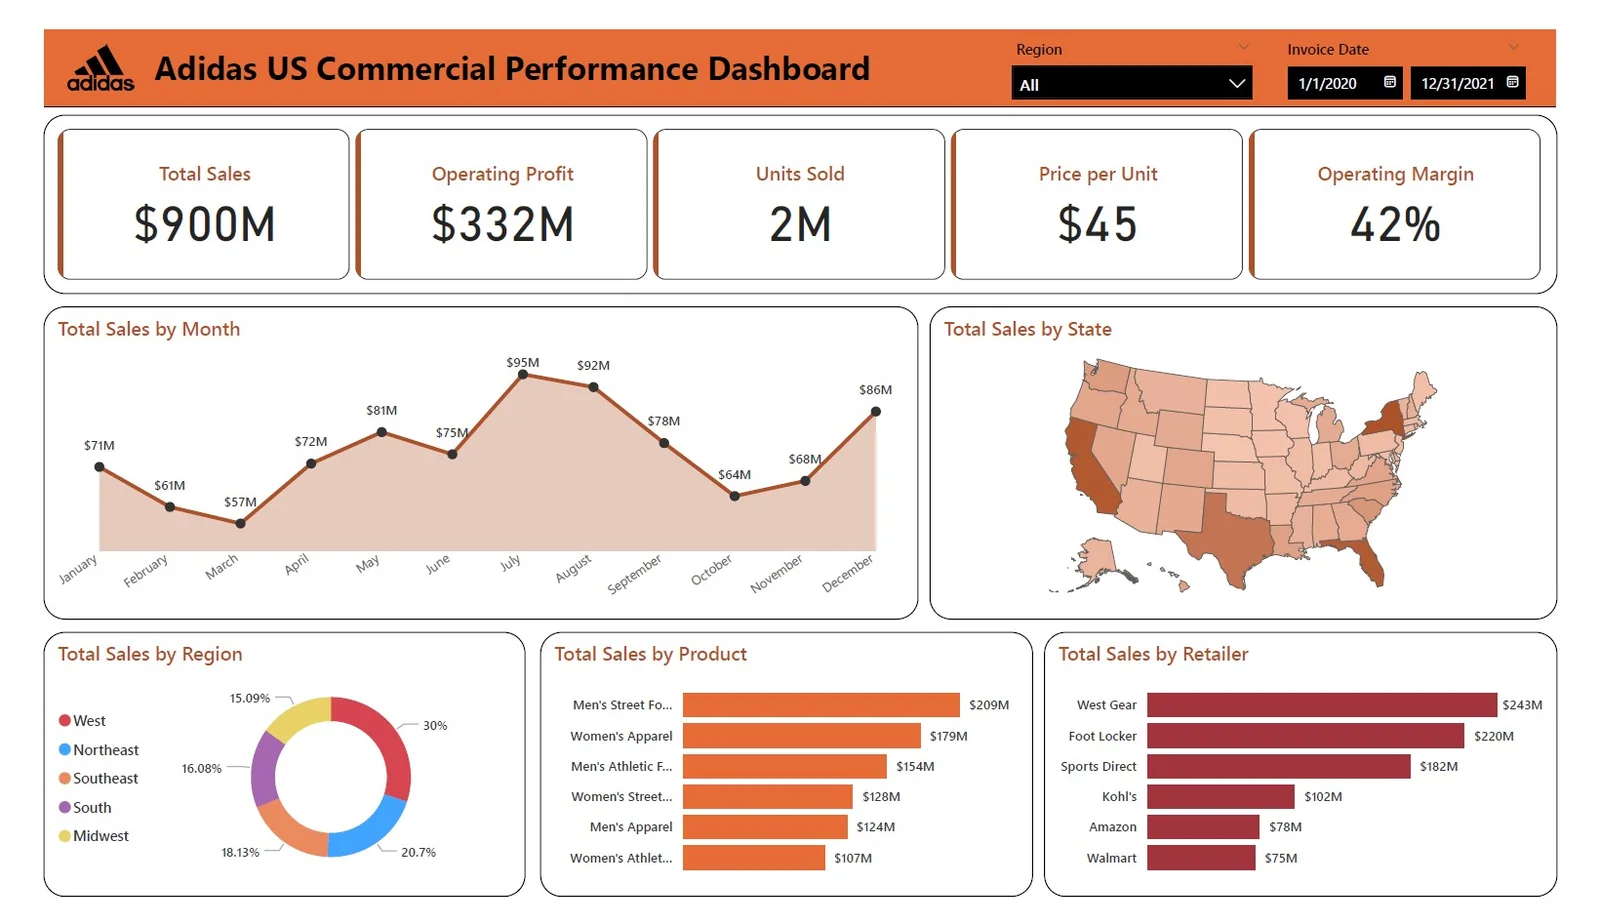
Olist E-Commerce Business Performance Analysis
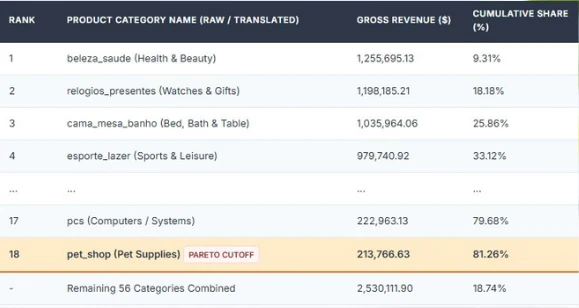
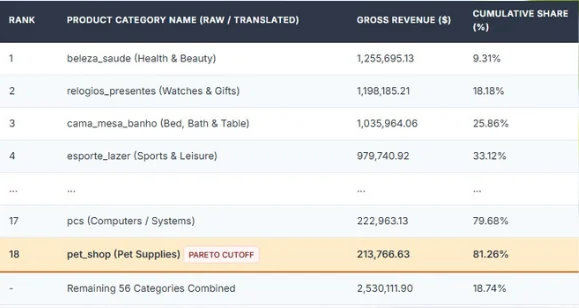
A SQL analysis: 18 of 74 product categories drove 81.26% of revenue, and reviews fell once delivery passed about 14 days.
PostgreSQL · SQL · Pareto analysis · KPI reporting
-
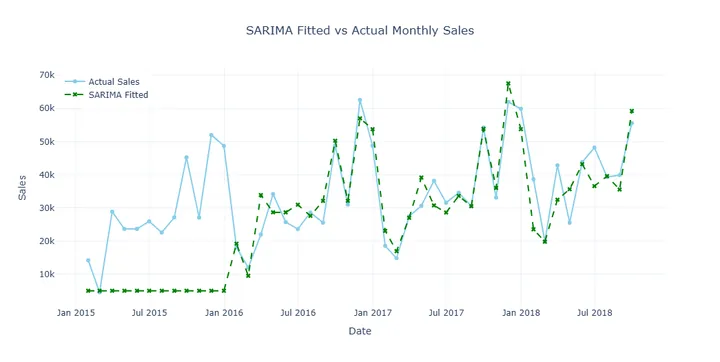
Global Superstore: Sales Analysis & Forecasting
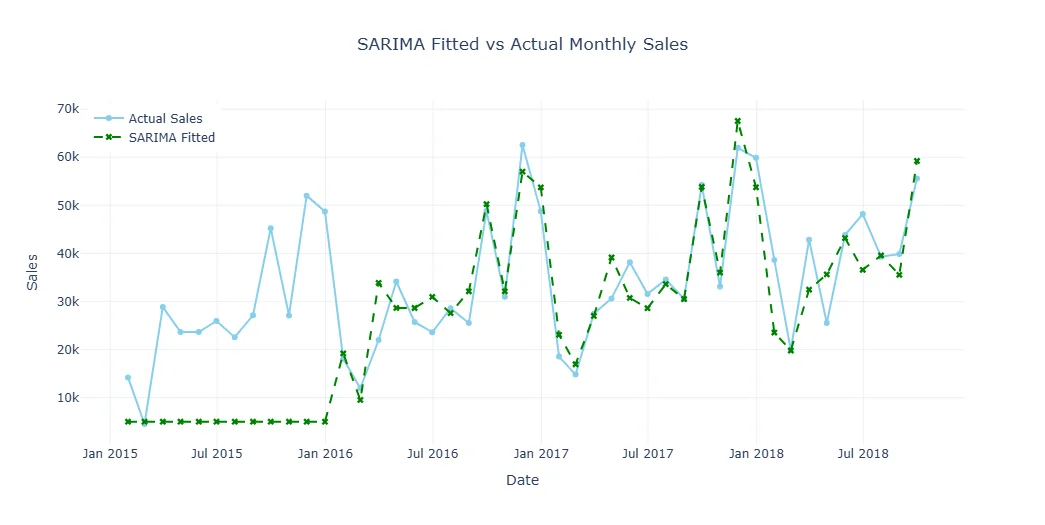
Daily forecasts failed (MAPE about 126%). Monthly SARIMA reached about 19%, a moderate result on a three-month test.
Python · pandas · Plotly · statsmodels · pmdarima · SARIMA
Services
Data work, end to end
From cleaning and reporting to predictive models. Each service has a clear scope and defined deliverables.
- Data Cleaning & PreparationAnalysis-ready data with every rule documented
- Exploratory Analysis & Insight ReportsAnswers to a specific business question
- Dashboards & BI ReportingInteractive dashboards built on reliable data models
- SQL Reporting & Workflow AutomationRepeatable reports and KPIs with less manual work
- Business & Marketing AnalyticsCustomer, campaign, and conversion insights
- Predictive Modeling & ForecastingForecasts and predictions with honest model evaluation
- AI/ML Data AnnotationConsistently labeled image and sensor data
- Data Quality & AI/ML Dataset ValidationValidated datasets ready for model training
Capabilities
Across the data science workflow
Data Analysis
Exploratory analysis, trend analysis, segmentation, and statistical methods to uncover patterns and answer business questions.
Data Science & ML
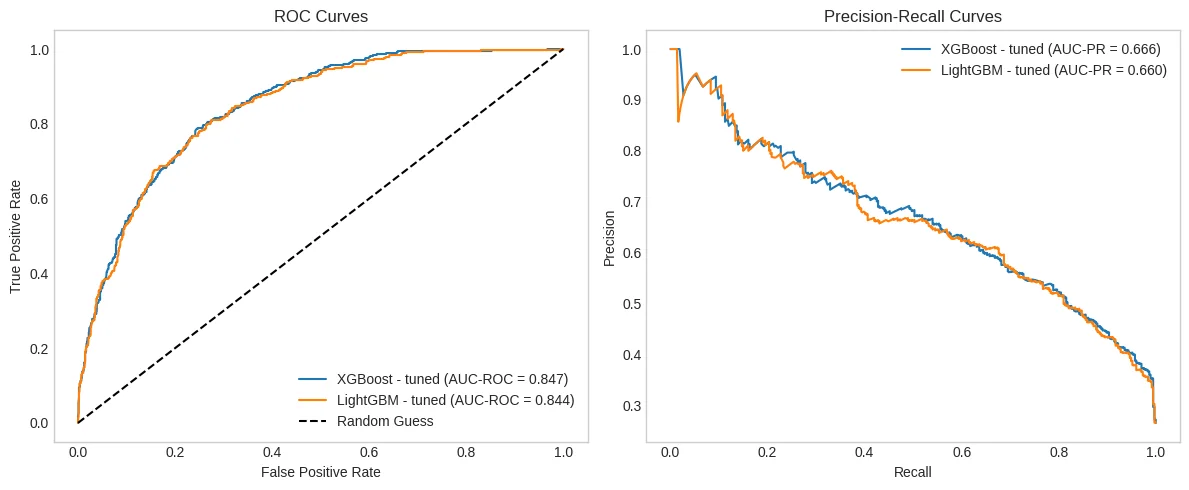
Statistical modeling, classification, forecasting, and model evaluation, with results explained in plain language.
BI & Visualization
Data modeling, reporting, interactive dashboards, and visual storytelling built around business needs.
Data Quality
Data cleaning, transformation, validation, and quality assurance to ensure reliable analysis and reporting.
Approach
Data quality first, decisions always
Define
Start from the decision. Pin down the question, the metric and what a useful answer looks like.
Validate
Test the data before trusting it. Missing values, duplicates and anomalies are found and documented.
Deliver
Clear analysis, models and dashboards, with definitions, limits and next steps stated.
Not just “what does the data say?” but “what decision can this data help us make?”