 Mostafizur Rahman
Retail Supply Chain Sales & Profitability Analytics
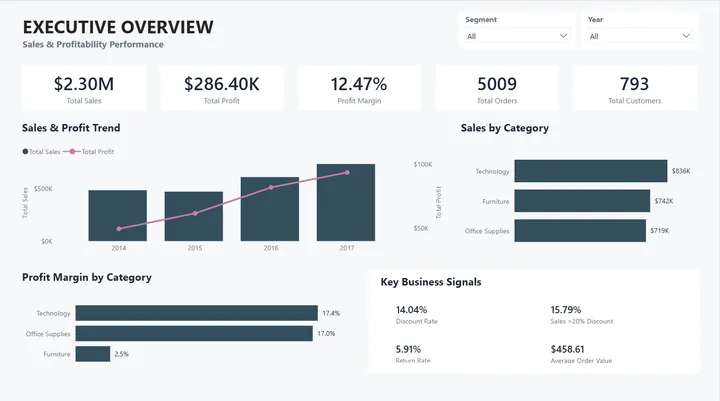
Discounts above 20% covered 15.79% of sales but lost $135,376 in profit. A Power BI report shows where margin disappears.
Python · Power Query · DAX · Power BI
Projects
Each case study covers the business question, the data, the method, the result, and its limits, with a focus on turning data into decisions.
6 projects
Discounts above 20% covered 15.79% of sales but lost $135,376 in profit. A Power BI report shows where margin disappears.
Python · Power Query · DAX · Power BI
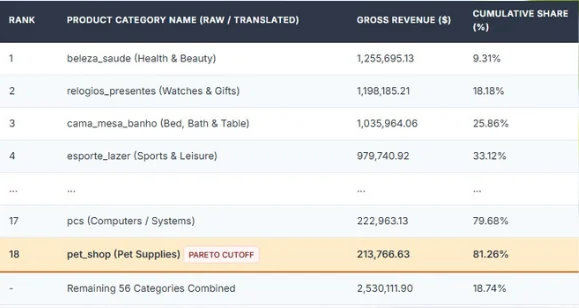
A SQL analysis: 18 of 74 product categories drove 81.26% of revenue, and reviews fell once delivery passed about 14 days.
PostgreSQL · SQL · Pareto analysis · KPI reporting
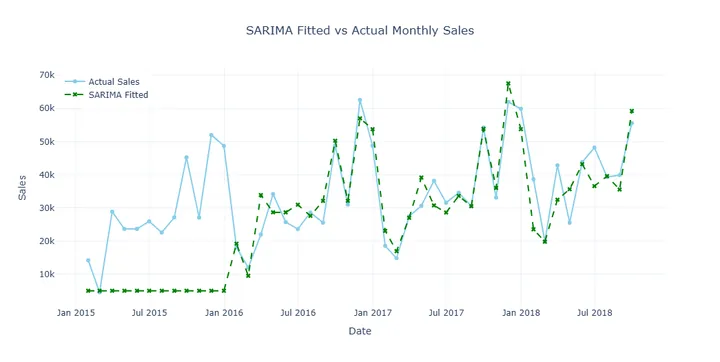
Daily forecasts failed (MAPE about 126%). Monthly SARIMA reached about 19%, a moderate result on a three-month test.
Python · pandas · Plotly · statsmodels · pmdarima · SARIMA
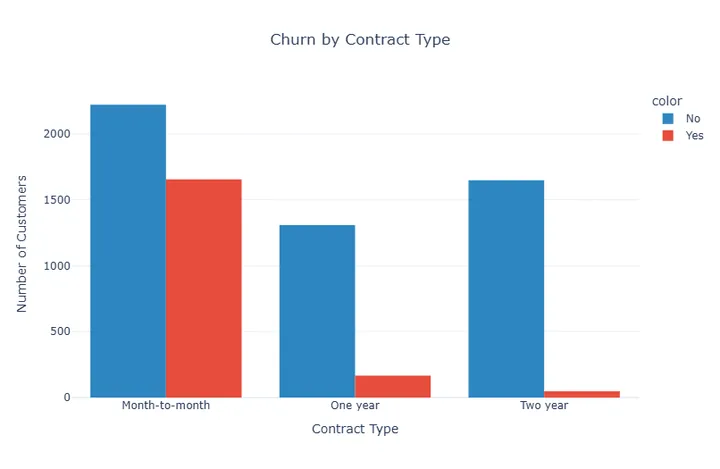
Which customers will leave? Tuned LightGBM reached 0.810 recall; short tenure and month-to-month contracts stood out.
Python · scikit-learn · LightGBM · XGBoost · SHAP
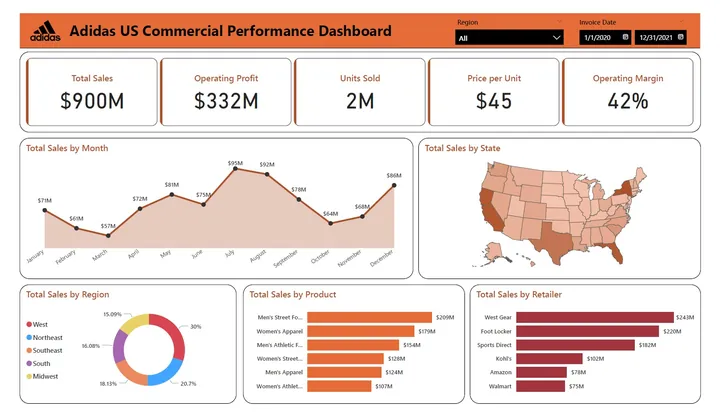
Revenue is concentrated in a few retailers, and top sellers aren't always the most profitable, shown in Power BI.
Power BI · DAX · Data cleaning
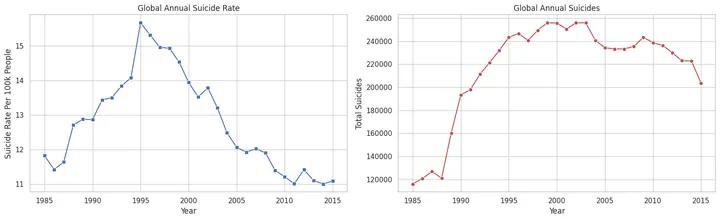
Recorded rates were highest among men aged 75+, and male rates swung far more than female rates in the mid-1990s.
Python · pandas · Matplotlib · Seaborn